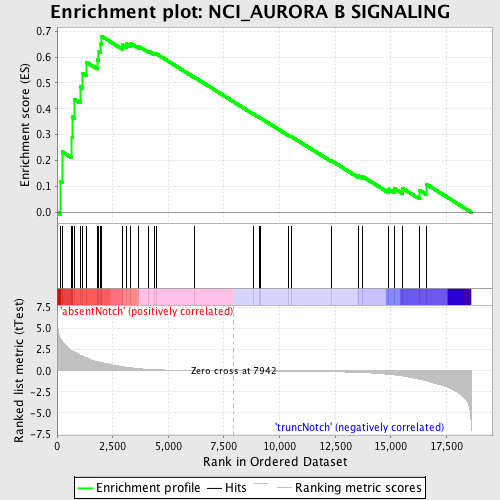
Profile of the Running ES Score & Positions of GeneSet Members on the Rank Ordered List
| Dataset | Set_03_absentNotch_versus_truncNotch.phenotype_absentNotch_versus_truncNotch.cls #absentNotch_versus_truncNotch.phenotype_absentNotch_versus_truncNotch.cls #absentNotch_versus_truncNotch_repos |
| Phenotype | phenotype_absentNotch_versus_truncNotch.cls#absentNotch_versus_truncNotch_repos |
| Upregulated in class | absentNotch |
| GeneSet | NCI_AURORA B SIGNALING |
| Enrichment Score (ES) | 0.68115395 |
| Normalized Enrichment Score (NES) | 1.6047536 |
| Nominal p-value | 0.004405286 |
| FDR q-value | 0.2711957 |
| FWER p-Value | 0.894 |
| PROBE | DESCRIPTION (from dataset) | GENE SYMBOL | GENE_TITLE | RANK IN GENE LIST | RANK METRIC SCORE | RUNNING ES | CORE ENRICHMENT | |
|---|---|---|---|---|---|---|---|---|
| 1 | CDCA8 | 2340286 6980019 | 157 | 3.797 | 0.1195 | Yes | ||
| 2 | NCAPH | 6220435 | 224 | 3.506 | 0.2341 | Yes | ||
| 3 | KIF23 | 5570112 | 668 | 2.363 | 0.2898 | Yes | ||
| 4 | NSUN2 | 2120193 | 676 | 2.354 | 0.3688 | Yes | ||
| 5 | RASA1 | 1240315 | 794 | 2.176 | 0.4358 | Yes | ||
| 6 | CUL3 | 1850520 | 1037 | 1.848 | 0.4851 | Yes | ||
| 7 | STMN1 | 1990717 | 1146 | 1.733 | 0.5376 | Yes | ||
| 8 | NCL | 2360463 4540279 | 1310 | 1.541 | 0.5808 | Yes | ||
| 9 | EVI5 | 6380040 | 1809 | 1.070 | 0.5901 | Yes | ||
| 10 | AURKA | 780537 | 1880 | 1.026 | 0.6209 | Yes | ||
| 11 | PPP1CC | 6380300 2510647 | 1943 | 0.993 | 0.6510 | Yes | ||
| 12 | NDC80 | 4120465 | 1990 | 0.969 | 0.6812 | Yes | ||
| 13 | KIF2C | 6940082 | 2928 | 0.487 | 0.6472 | No | ||
| 14 | PPP2R5D | 4010156 380408 5550112 5670162 | 3110 | 0.422 | 0.6517 | No | ||
| 15 | RACGAP1 | 3990162 6620736 | 3299 | 0.354 | 0.6535 | No | ||
| 16 | SMC2 | 4810133 | 3670 | 0.247 | 0.6419 | No | ||
| 17 | SMC4 | 5910240 | 4118 | 0.158 | 0.6232 | No | ||
| 18 | INCENP | 520593 | 4390 | 0.124 | 0.6128 | No | ||
| 19 | MYLK | 4010600 7000364 | 4454 | 0.118 | 0.6133 | No | ||
| 20 | NPM1 | 4730427 | 6182 | 0.034 | 0.5216 | No | ||
| 21 | CBX5 | 3830072 6290167 | 8836 | -0.015 | 0.3793 | No | ||
| 22 | PSMA3 | 5900047 7040161 | 9078 | -0.019 | 0.3670 | No | ||
| 23 | KLHL13 | 6590731 | 9141 | -0.020 | 0.3643 | No | ||
| 24 | DES | 1450341 | 10402 | -0.045 | 0.2981 | No | ||
| 25 | AURKC | 4060687 | 10526 | -0.048 | 0.2931 | No | ||
| 26 | KIF20A | 2650050 | 12325 | -0.108 | 0.2000 | No | ||
| 27 | BUB1 | 5390270 | 13543 | -0.197 | 0.1411 | No | ||
| 28 | CENPA | 5080154 | 13738 | -0.221 | 0.1381 | No | ||
| 29 | SGOL1 | 1980075 5220092 6020711 | 14887 | -0.410 | 0.0902 | No | ||
| 30 | VIM | 20431 | 15151 | -0.483 | 0.0923 | No | ||
| 31 | BIRC5 | 110408 580014 1770632 | 15518 | -0.608 | 0.0931 | No | ||
| 32 | RHOA | 580142 5900131 5340450 | 16279 | -1.002 | 0.0860 | No | ||
| 33 | AURKB | 5890739 | 16583 | -1.180 | 0.1094 | No |

